How to Use Board Heatmap
Get started in under a minute.
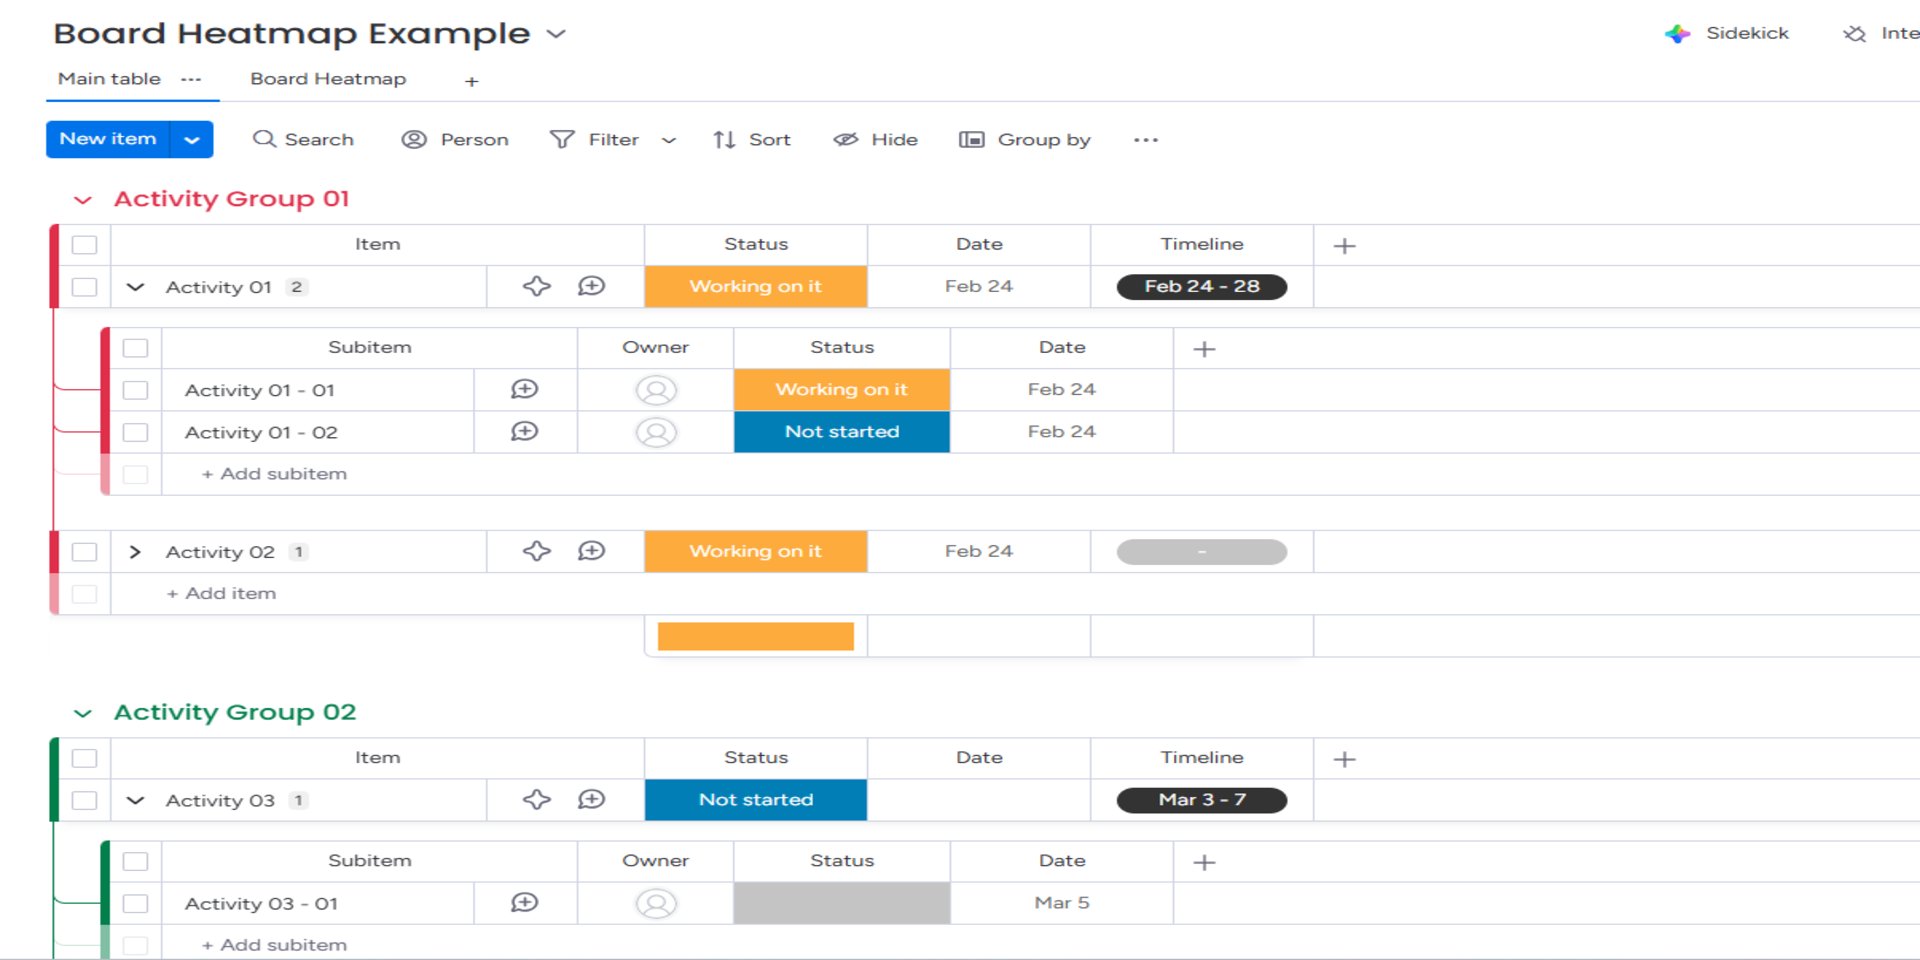
1Getting Started
Add Board Heatmap as a Board View from the views menu on any board. Click the + button in your views bar, search for "Board Heatmap," and add it.
2Select a Date Column
Use the dropdown at the top to pick which date or timeline column drives the heatmap. You can also change the year, switch color themes, and toggle subitems on or off.
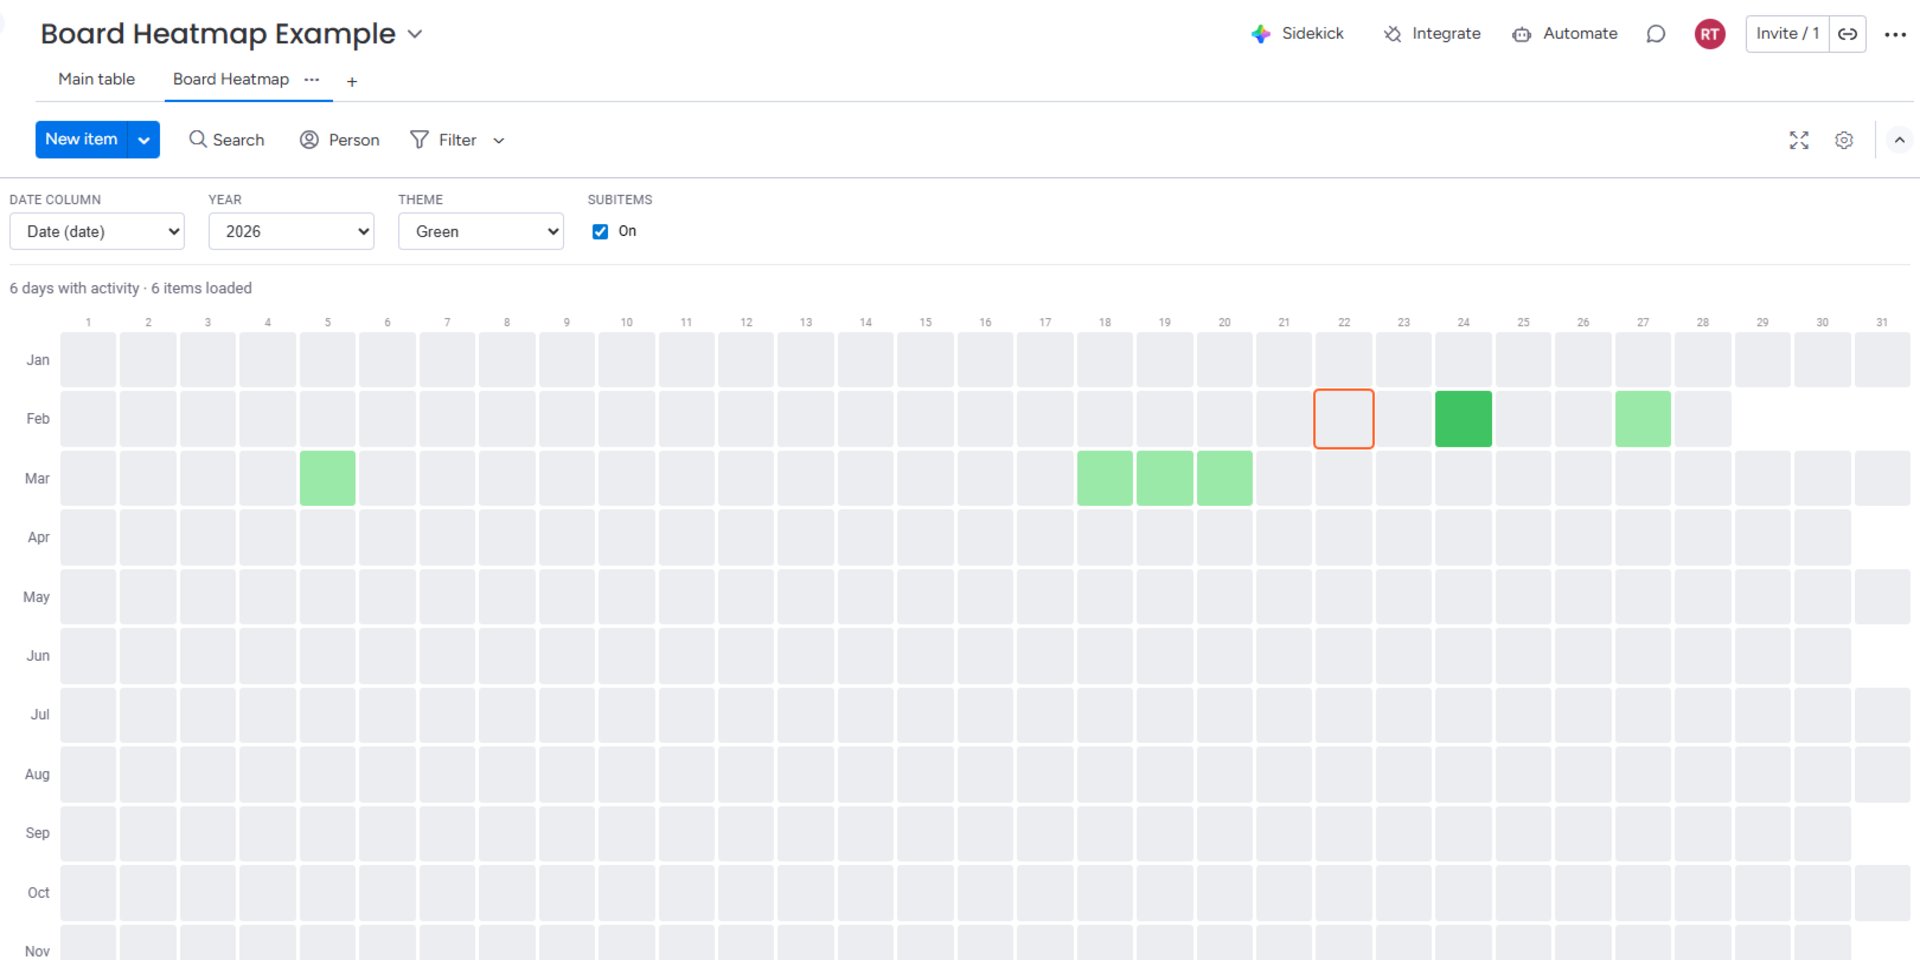
3Read the Heatmap
Each cell represents one day. Darker colors mean more items are scheduled on that date. Hover over any cell to see the exact count. The legend at the bottom shows the intensity scale from "Less" to "More."
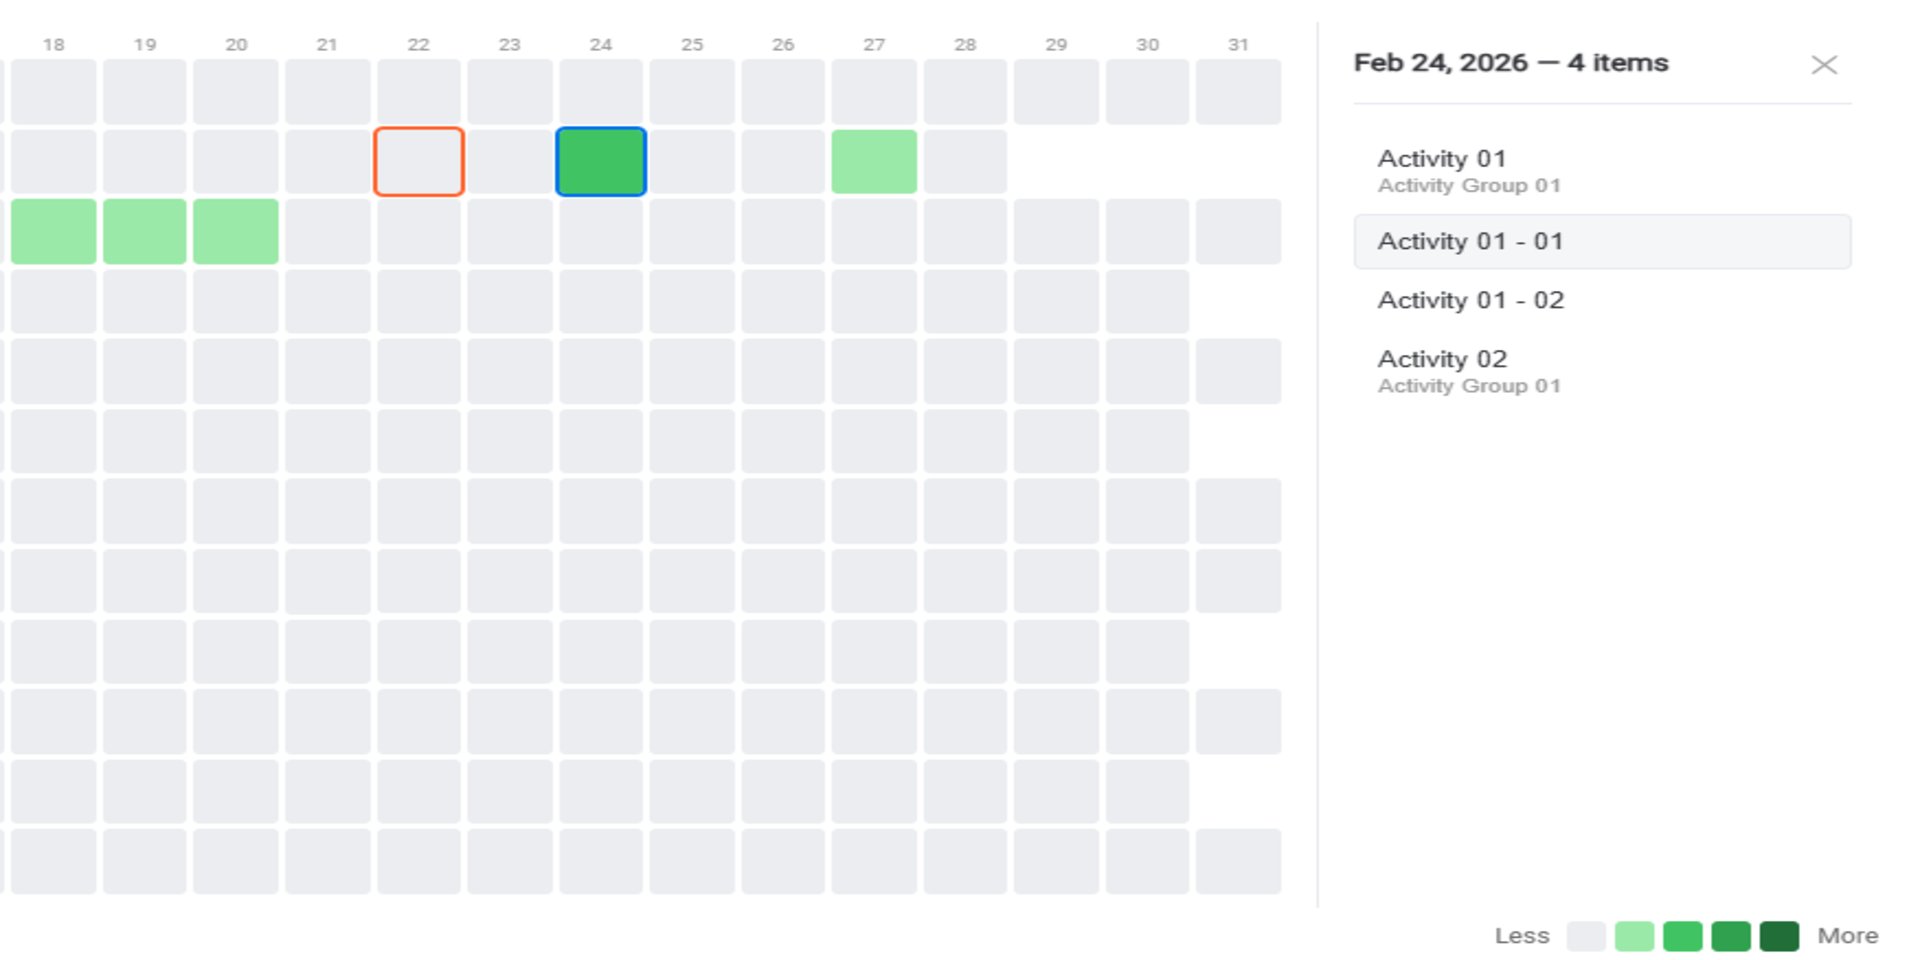
4Click a Day
Click any colored cell to open the Day Detail panel. This shows all items scheduled on that date, organized by group, with the date and item count at the top.
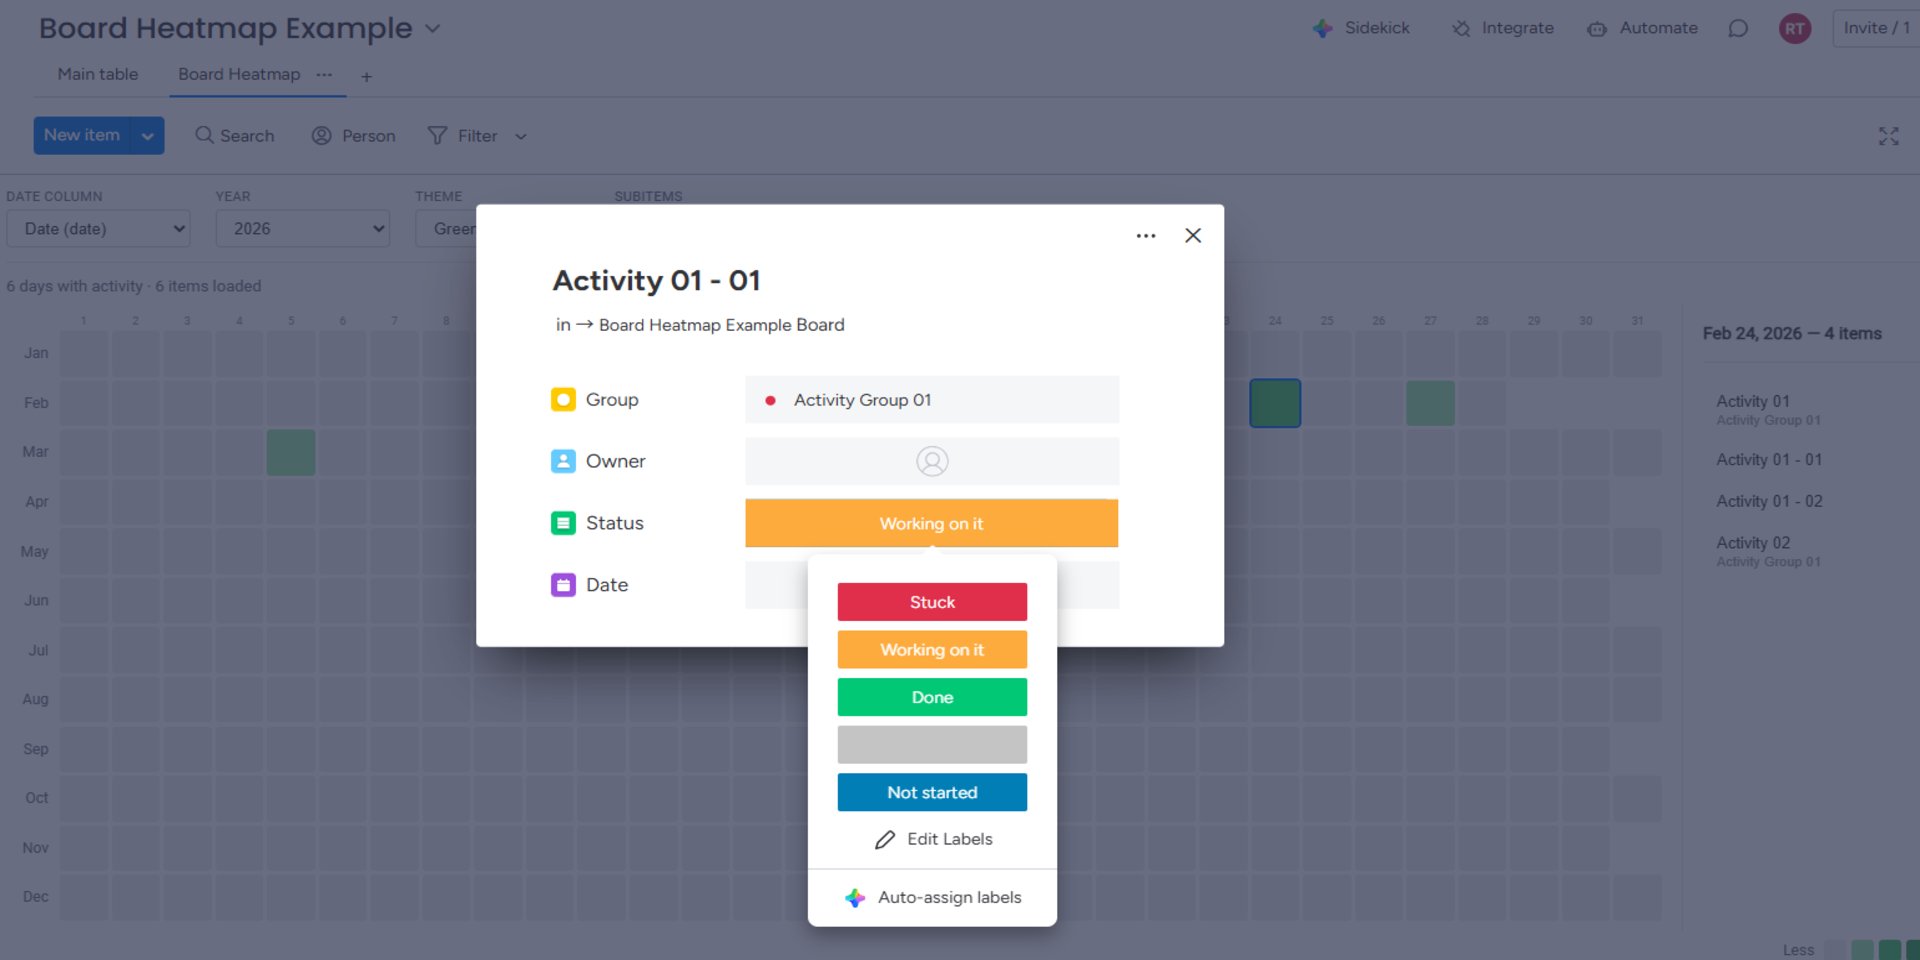
5Open Items
Click any item name in the Day Detail panel to open the item card directly in monday.com. You can view and edit the item's details — status, owner, dates — without leaving the heatmap view.
6Customize
Switch between Green, Blue, and Orange color themes using the Theme dropdown. Toggle subitems on or off to include or exclude nested item data. Change the year to view historical or future data.
💡 Tip: Board Heatmap is read-only — it never modifies your board data. Your information stays safe and unchanged.